library(tidyverse)
## -- Attaching packages --------------------------------------- tidyverse 1.3.1 --
## v ggplot2 3.3.5     v purrr   0.3.4
## v tibble  3.1.4     v dplyr   1.0.7
## v tidyr   1.1.3     v stringr 1.4.0
## v readr   2.0.1     v forcats 0.5.1
## -- Conflicts ------------------------------------------ tidyverse_conflicts() --
## x dplyr::filter() masks stats::filter()
## x dplyr::lag()    masks stats::lag()
library(ggrepel)
receiver <- read_csv("data/receivers.csv")
## Rows: 499 Columns: 19
## -- Column specification --------------------------------------------------------
## Delimiter: ","
## chr  (3): Player, Tm, Pos
## dbl (16): Rk, Age, G, GS, Tgt, Rec, Ctch%, Yds, Y/R, TD, 1D, Lng, Y/Tgt, R/G...
##
## i Use `spec()` to retrieve the full column specification for this data.
## i Specify the column types or set `show_col_types = FALSE` to quiet this message.
receiver <- receiver %>%
  mutate(`Tgt` + `Rec`)
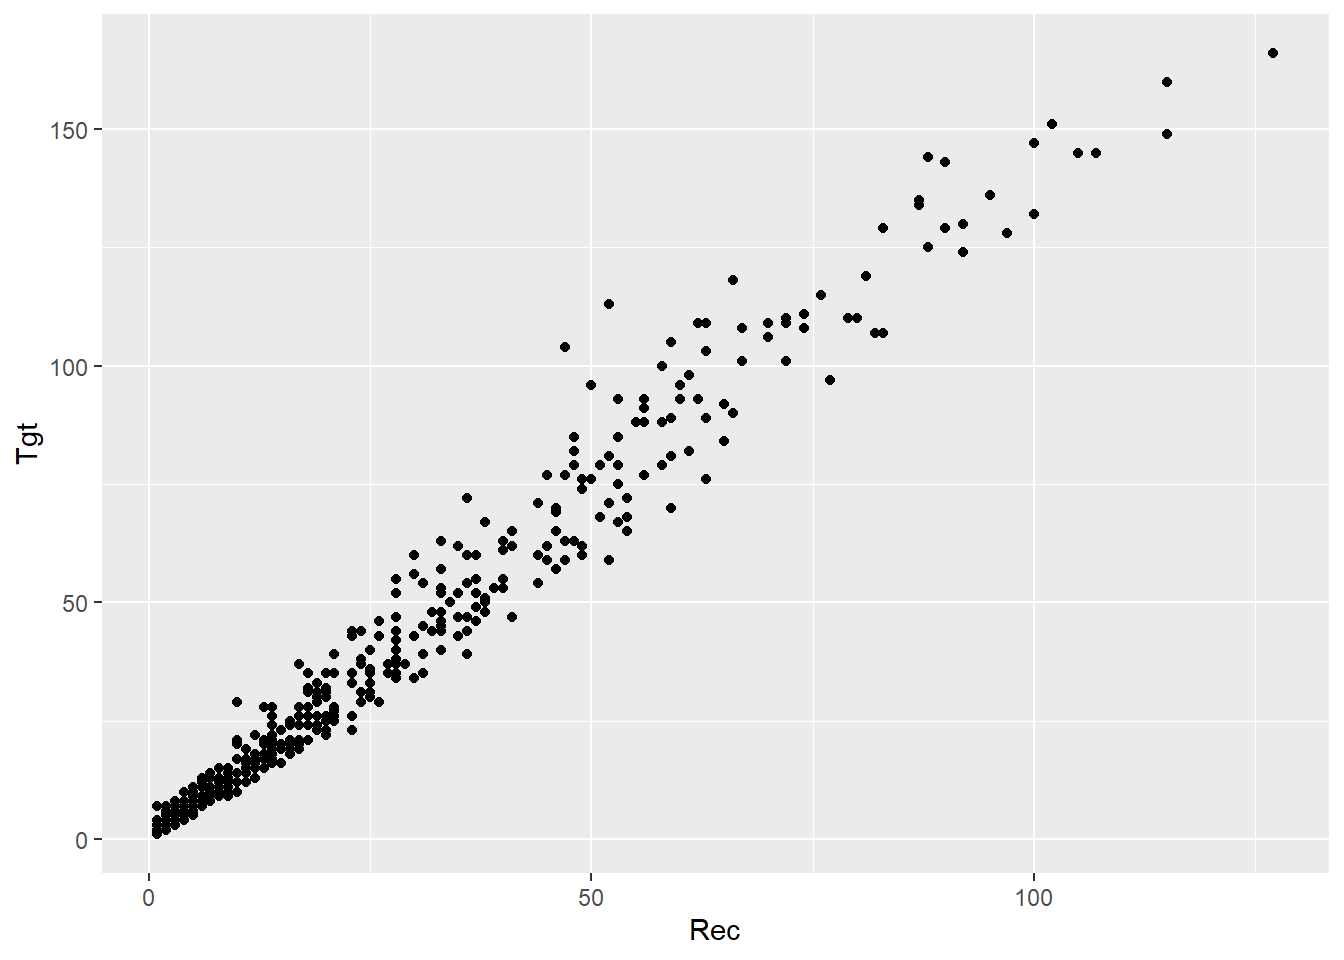
ggplot() +
  geom_point(
    data = receiver,
    aes(x = `Rec`, y = `Tgt`)
  )
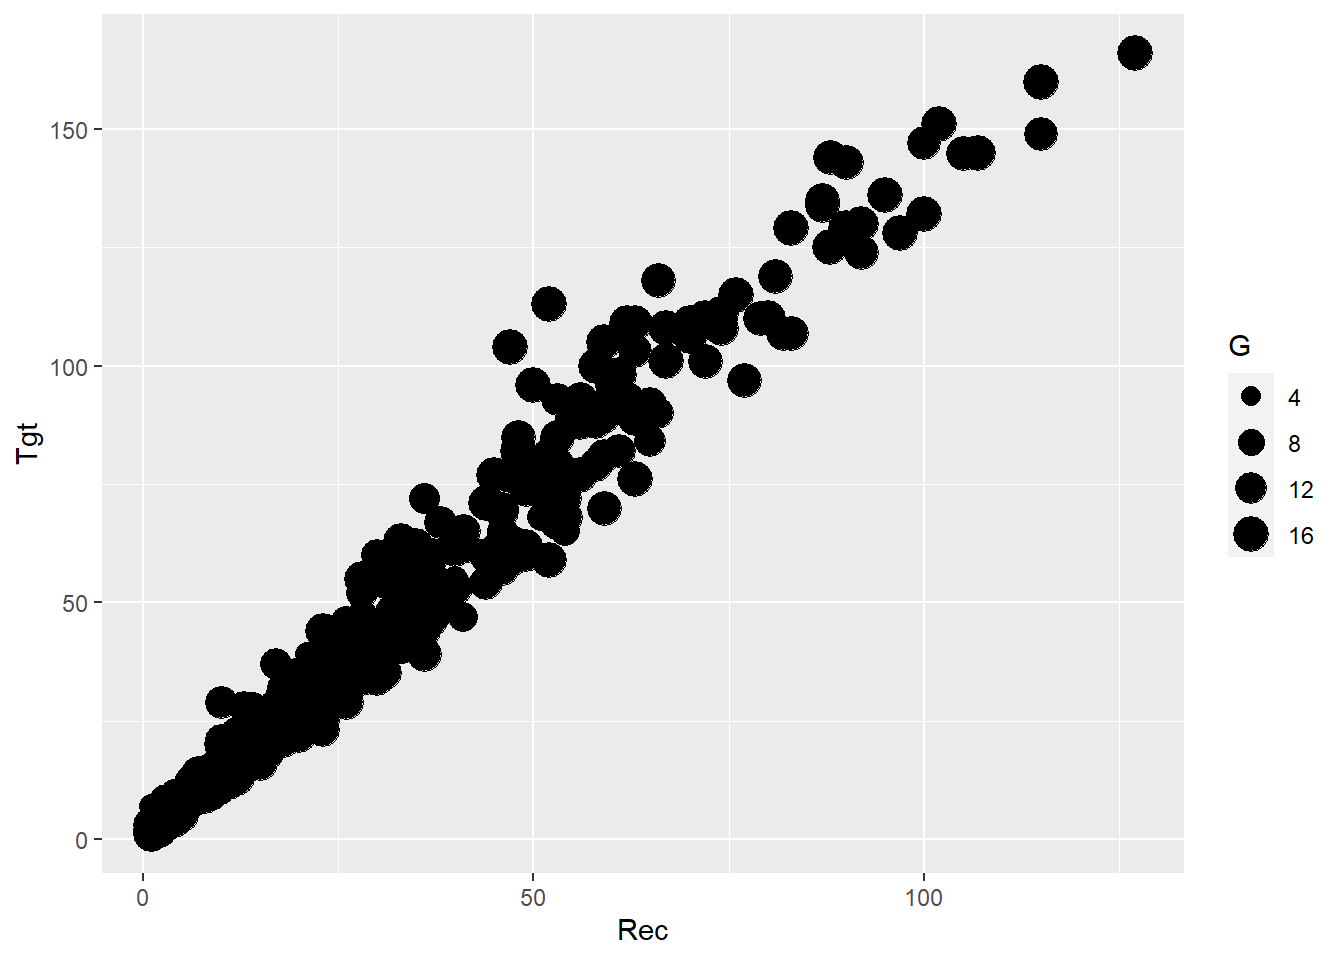
ggplot() +
  geom_point(
    data = receiver,
    aes(x = `Rec`, y = `Tgt`, size = G)
  )
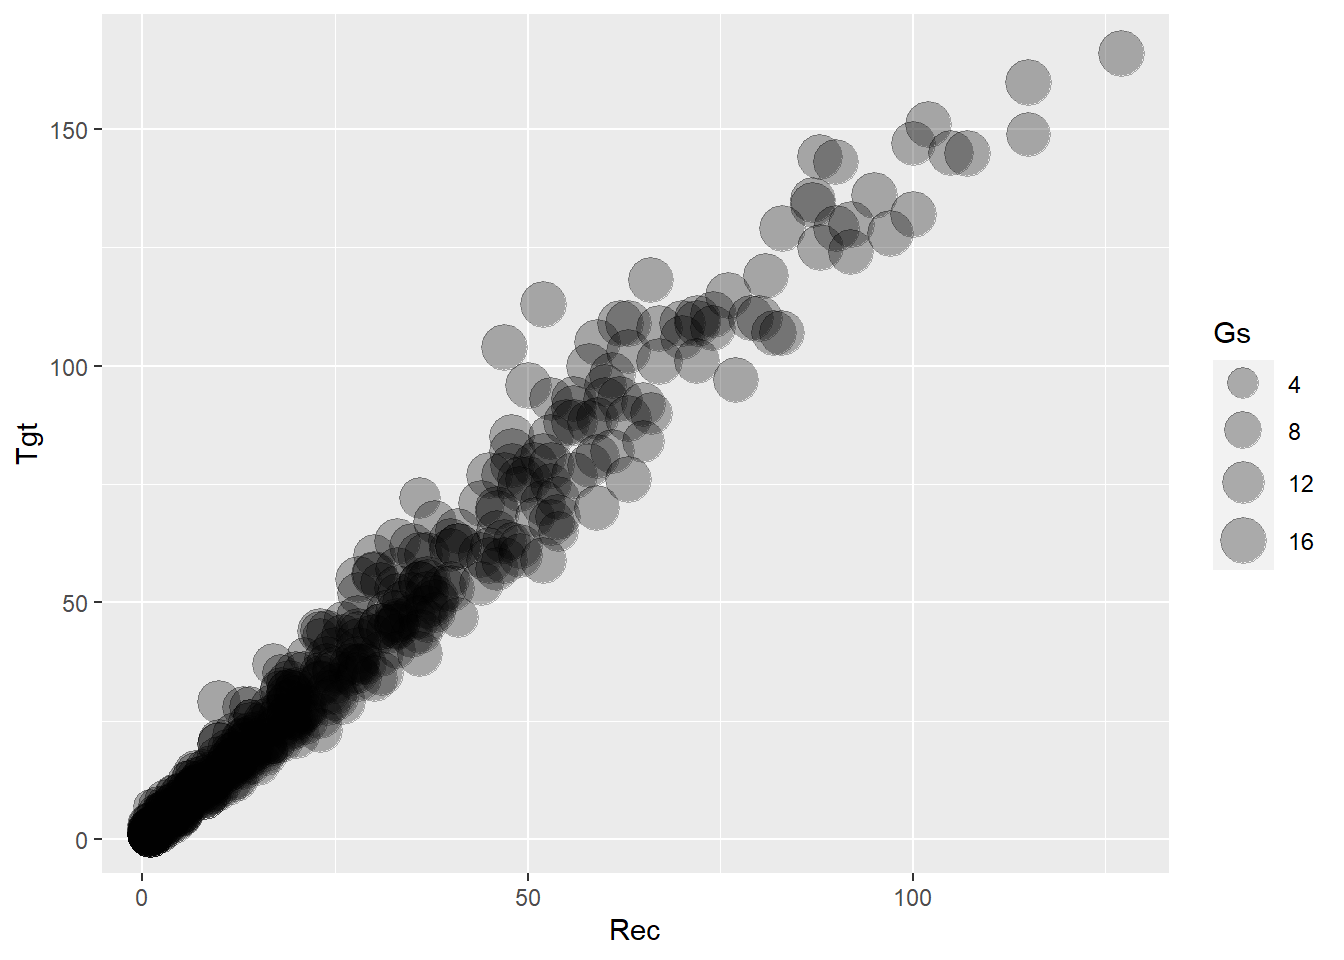
ggplot() +
  geom_point(
    data = receiver,
    aes(x = `Rec`, y = `Tgt`, size = G),
    alpha = .3
  ) +
  scale_size(range = c(3, 8), name="Gs")
receiver %>%
  ungroup() %>%
  summarise(
    avg_rec = mean(`Rec`),
    avg_tgt = mean(`Tgt`)
  )
## # A tibble: 1 x 2
##   avg_rec avg_tgt
##     <dbl>   <dbl>
## 1    23.6    34.6
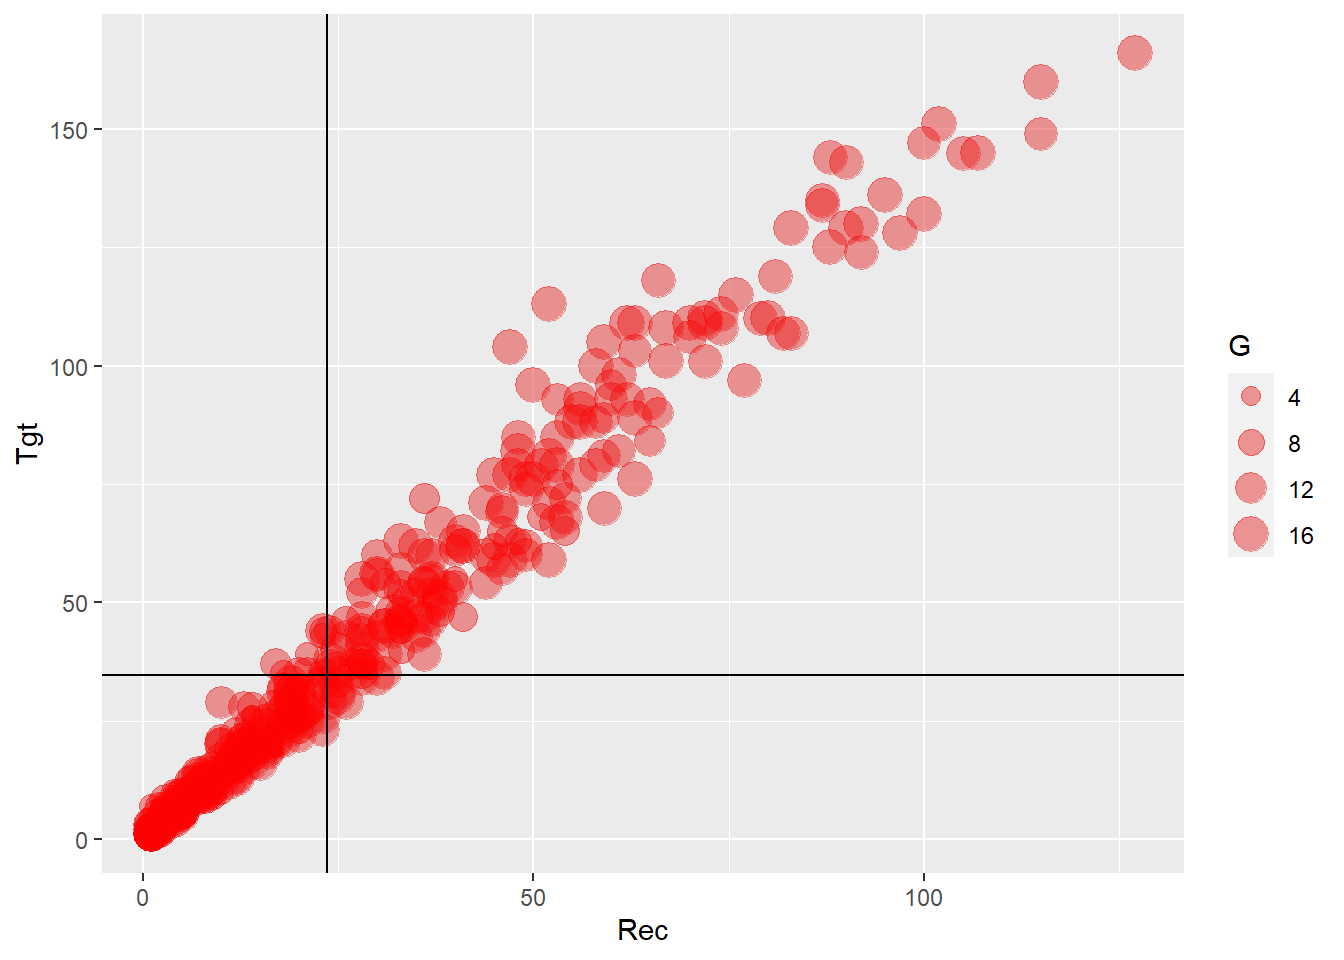
ggplot() +
  geom_point(
    data = receiver,
    aes(x = `Rec`, y = `Tgt`, size = G),
    color = "grey",
    alpha = .35
  ) +
  geom_point(
    data = receiver,
    aes(x = `Rec`, y = `Tgt`, size = G),
    color = "red",
    alpha = .35
  ) +
  geom_vline(xintercept = 23.55912) +
  geom_hline(yintercept = 34.61924)
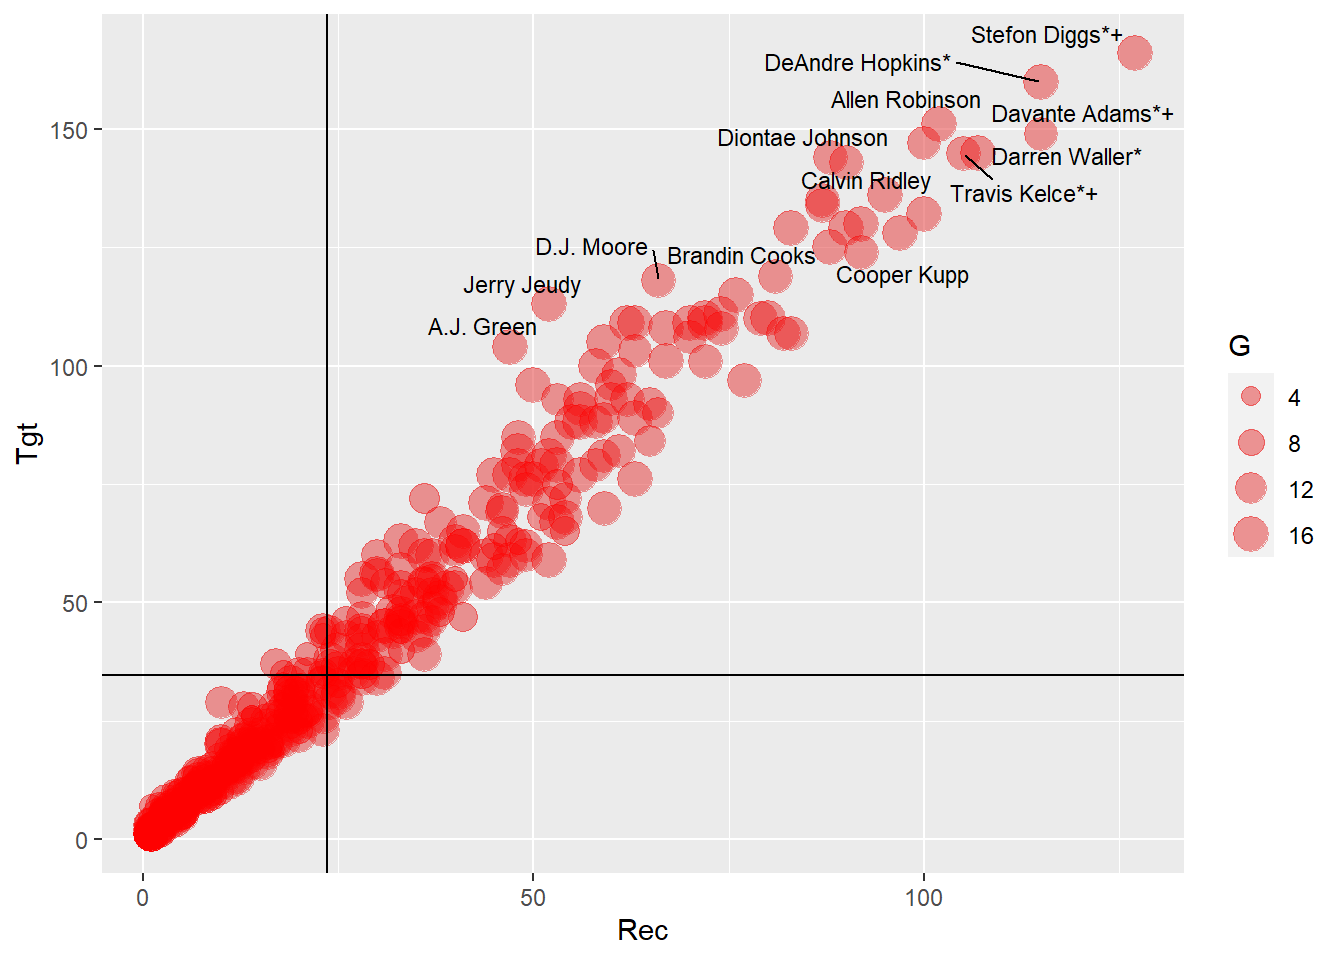
ggplot() +
  geom_point(
    data = receiver,
    aes(x = `Rec`, y = `Tgt`, size = G),
    color = "grey",
    alpha = .35
  ) +
  geom_point(
    data = receiver,
    aes(x = `Rec`, y = `Tgt`, size = G),
    color = "red",
    alpha = .35
  ) +
  geom_vline(xintercept = 23.55912) +
  geom_hline(yintercept = 34.61924) +
  geom_text_repel(
    data = receiver,
    aes(x = `Rec`, y = `Tgt`, label = Player),
    size = 3
  )
## Warning: ggrepel: 486 unlabeled data points (too many overlaps). Consider
## increasing max.overlaps
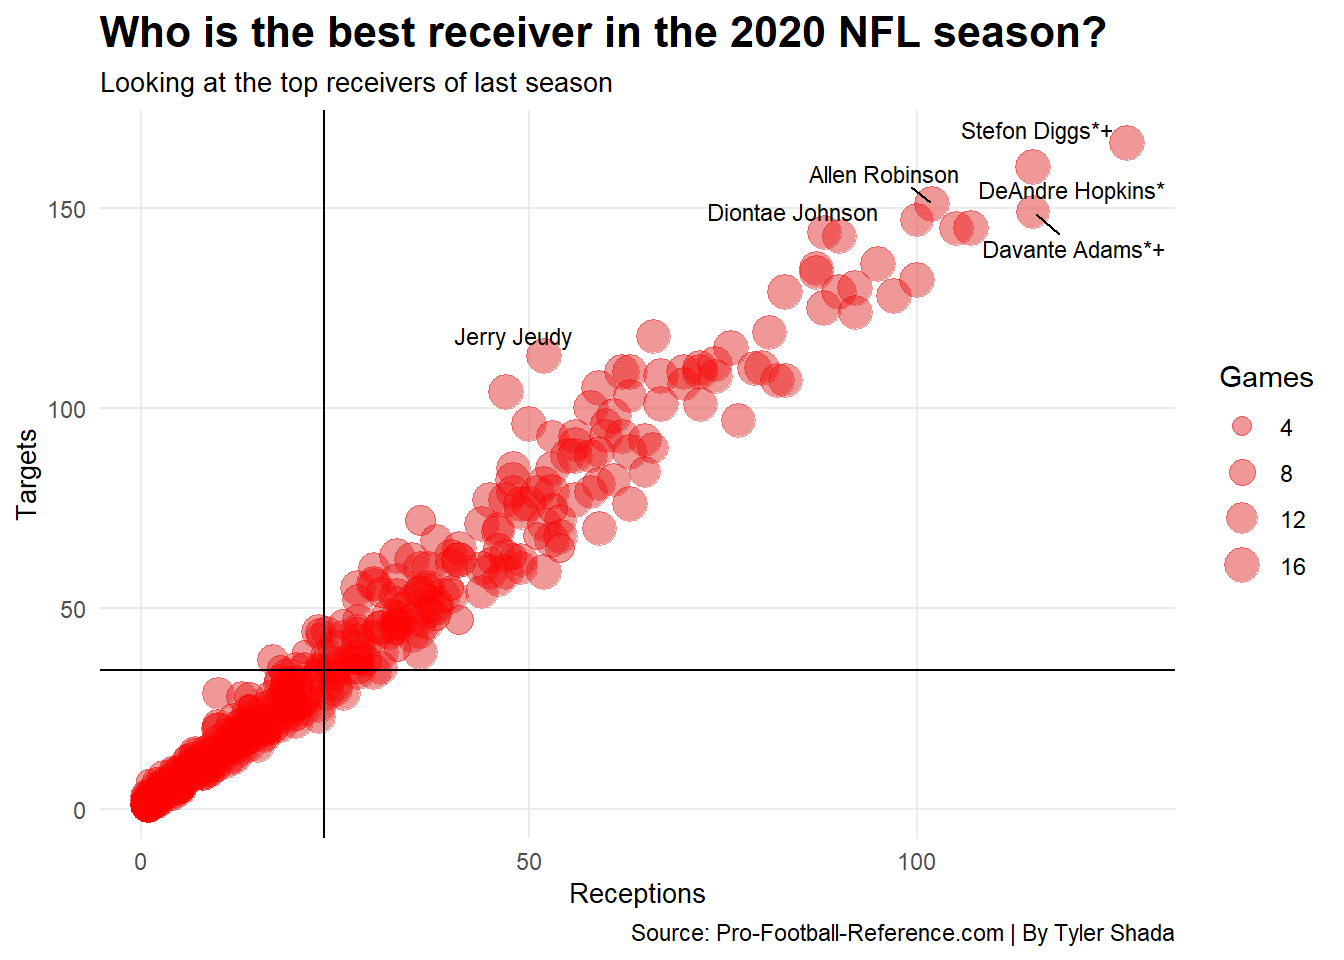
ggplot() +
  geom_point(
    data = receiver,
    aes(x = `Rec`, y = `Tgt`, size = G),
    color = "grey",
    alpha = .35
  ) +
  geom_point(
    data = receiver,
    aes(x = `Rec`, y = `Tgt`, size = G),
    color = "red",
    alpha = .35
  ) +
  geom_vline(xintercept = 23.55912) +
  geom_hline(yintercept = 34.61924) +
  geom_text_repel(
    data = receiver,
    aes(x = `Rec`, y = `Tgt`, label = Player),
    size = 3
  ) +
  labs(
    x = "Receptions",
    y = "Targets",
    title = "Who is the best receiver in the 2020 NFL season?",
    subtitle = "Looking at the top receivers of last season",
    caption = "Source: Pro-Football-Reference.com | By Tyler Shada",
    size = "Games"
  ) +
  theme_minimal() +
  theme(
    plot.title = element_text(size = 16, face = "bold"),
    axis.title = element_text(size = 10),
    plot.subtitle = element_text(size=10),
    panel.grid.minor = element_blank()
    )
## Warning: ggrepel: 493 unlabeled data points (too many overlaps). Consider
## increasing max.overlaps